How dangerous is extreme heat in your neighborhood? This map tells you
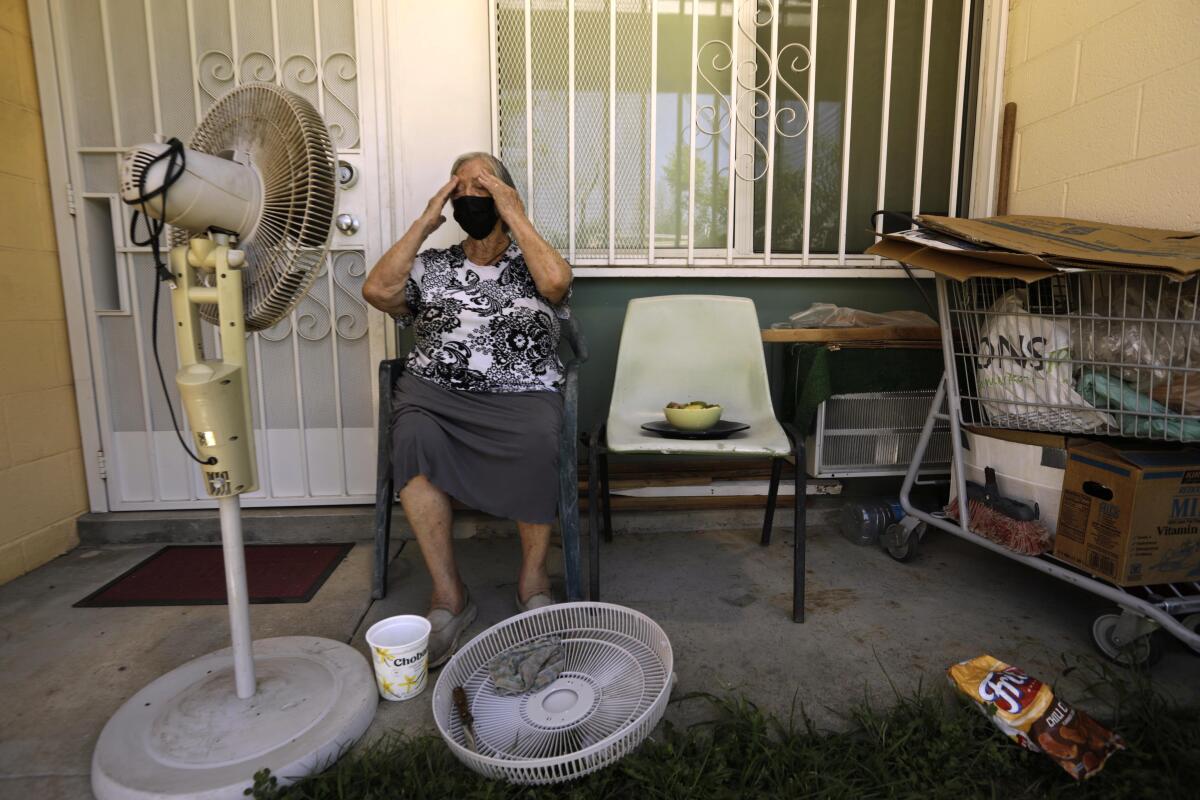
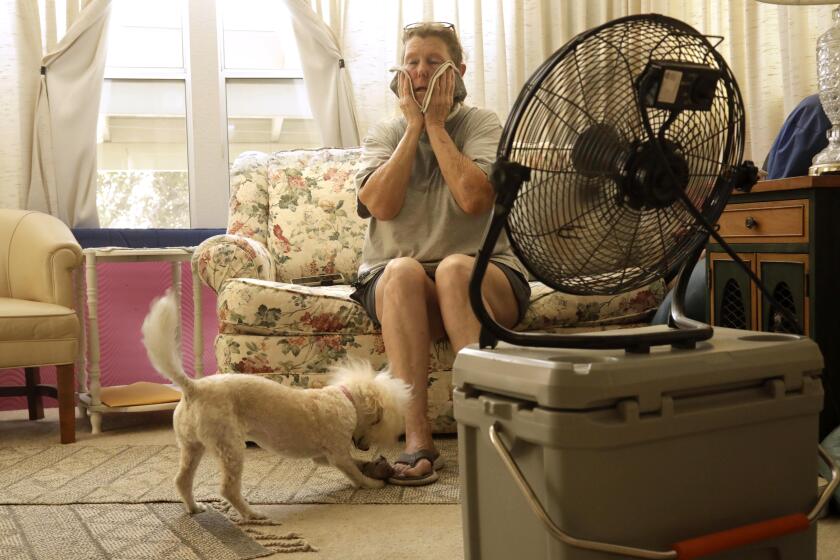
Extreme heat is fueling more than 1,500 excess emergency room visits per “heat day” in Los Angeles County, with some neighborhoods facing far more danger than others, according to a new UCLA mapping tool.
The heat map tracks the number and rate of excess emergency room visits on heat days down to the community level and highlights a stark disparity between wealthier, leafier neighborhoods and those that are home to fewer trees, more concrete and higher occurrences of underlying health issues.
The West Adams neighborhood in South Los Angeles, for example, averages excess emergency room visits at a rate four times that of the Westside neighborhood of Rancho Park — about 3.5 per 10,000 people compared with 0.9, according to the map. Heat days are defined by a combination of factors including temperature, humidity and cloud cover.
“We have a lot of information about how California broadly has been affected by heat — we know that heat is increasing and that we’re developing a greater and greater number of heat days as climate change gets worse and worse,” said David Eisenman, co-director of the UCLA Center for Public Health and Disasters. “But the difference really comes down at the neighborhood level.”
California chronically undercounts the death toll from extreme heat, which disproportionately harms the poor, the elderly and others who are vulnerable.
The parts of L.A. County that show higher rates of ER visits during heat days include the South L.A. corridor down to the ports, the San Pedro area, and the northwest Valley, especially San Fernando and Pacoima, said Eisenman, who is also a professor at the UCLA Fielding School of Public Health.
The findings mirror those outlined in the county’s first-ever Climate Vulnerability Assessment, released last fall, which found that social and economic inequality is leaving millions at a disadvantage as the climate crisis worsens.
According to that report, extreme heat will increase in frequency, severity and duration — including a potential tenfold increase in the occurrence of heat waves by mid-century. The largest increases will occur in the Santa Clarita and San Fernando valleys, the report says.
Eisenman said the mapping tool is still in beta testing mode, but the researchers decided to release it this week because California is heading into the hottest and most dangerous time of year. In June last year, a devastating heat wave in the Pacific Northwest was linked to the deaths of at least 1,400 people.
Although extreme heat has become the leading cause of weather-related deaths in the United States, a Times investigation found that such deaths are chronically undercounted.
“It’s a silent killer,” Eisenman said, noting that unlike disasters such as tornadoes or hurricanes in which the destruction is visible, “the pictures from before and after a heat wave look exactly the same, so we haven’t really gotten the message out that heat is happening.”
A new county report lays bare how social and economic inequality have left millions of local residents vulnerable as the climate crisis heats up.
More than 12 million Americans were under excessive heat warnings on Monday, according to the National Oceanic and Atmospheric Administration. What’s more, the agency’s most recent seasonal outlook shows a higher likelihood of above-normal temperatures across the western U.S. until at least September.
Eisenman said the findings in L.A. County are in some ways not surprising in that they echo the “decades of redlining” that have led to differences in shade, access to air conditioning and even base-line health levels in some L.A. communities. Redlining was the institutional practice of denying homeownership and financial services to residents based on race.
He also noted that many people who visit the ER on heat days aren’t there specifically for heat-related illness, but because the heat has exacerbated other underlying health issues such as diabetes, kidney dysfunction and heart disease.
Marta Segura, the city of L.A.’s newly appointed “chief heat officer,” said in a statement that the heat risk map will help planners “target resources to the most vulnerable areas exposed to extreme heat and thus prioritize the mitigation and adaptation measures where they are most needed.”
Among her office’s goals are the creation of an early warning system for heat waves, and the development of long-term strategies to reduce heat exposure, such as planting trees and updating building codes, she told The Times last month.
The move would raise awareness of the deadly effects of extreme heat events, which experts say kill more people than any other climate-driven hazard.
The map also shows some surprising variations across the state, with the highest rate of excess daily ER visits from extreme heat in the northwestern counties of Del Norte, Humboldt and Trinity. The California counties with the lowest rate of ER visits are Monterey, Kings and Alpine.
Eisenman said the reasons for this could be myriad, including that the residents and infrastructure in those northern counties may be less prepared for heat days. There may be fewer houses with air conditioning and also higher numbers of outdoor workers in rural areas, he said.
However, the rate of ER visits is only one metric of extreme heat. The counties with the highest number of ER visits during extreme heat days were Los Angeles, San Diego and Alameda, according to the map.
The sheer volume of heat-related ER visits in those counties can also help direct the response, Eisenman said, particularly when it comes to staffing and equipment.
“Our hope is that communities will take this information and call their assemblyman and their city agencies and say: ‘What are we doing about this right now?‘” he said. “Because heat is harming us right now.”
More to Read
Sign up for Essential California
The most important California stories and recommendations in your inbox every morning.
You may occasionally receive promotional content from the Los Angeles Times.
