California’s recent rains won’t end our stubborn drought. These charts show why
California just received more precipitation in the last three months of 2021 than it got in the previous year. The mountains are heaped with historic amounts of heavy snow. But the rain had no sooner given way to sun than state regulators issued new rules forbidding water-wasting practices such as hosing down sidewalks and driveways. What’s going on?
The short version is that, although 33.9 trillion gallons of water have fallen on the state since Oct. 1, that’s not enough to wash away our tenacious drought. Here are some graphics to help to tell the story.
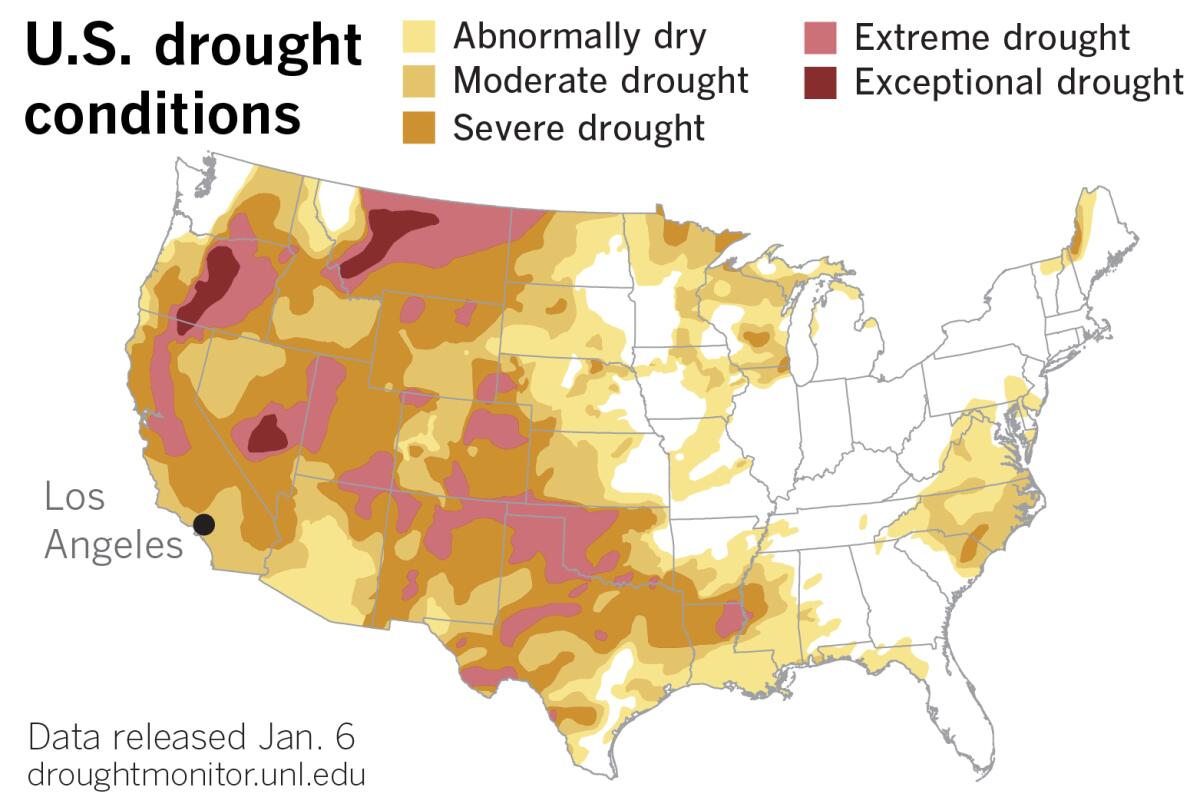
The latest U.S. Drought Monitor report, released Thursday, shows continuing improvement across the West because of what it called heavy precipitation and generous snowpack in mountainous areas. But all of California still remains in some level of drought. And much of the state remains in the severe or extreme category.
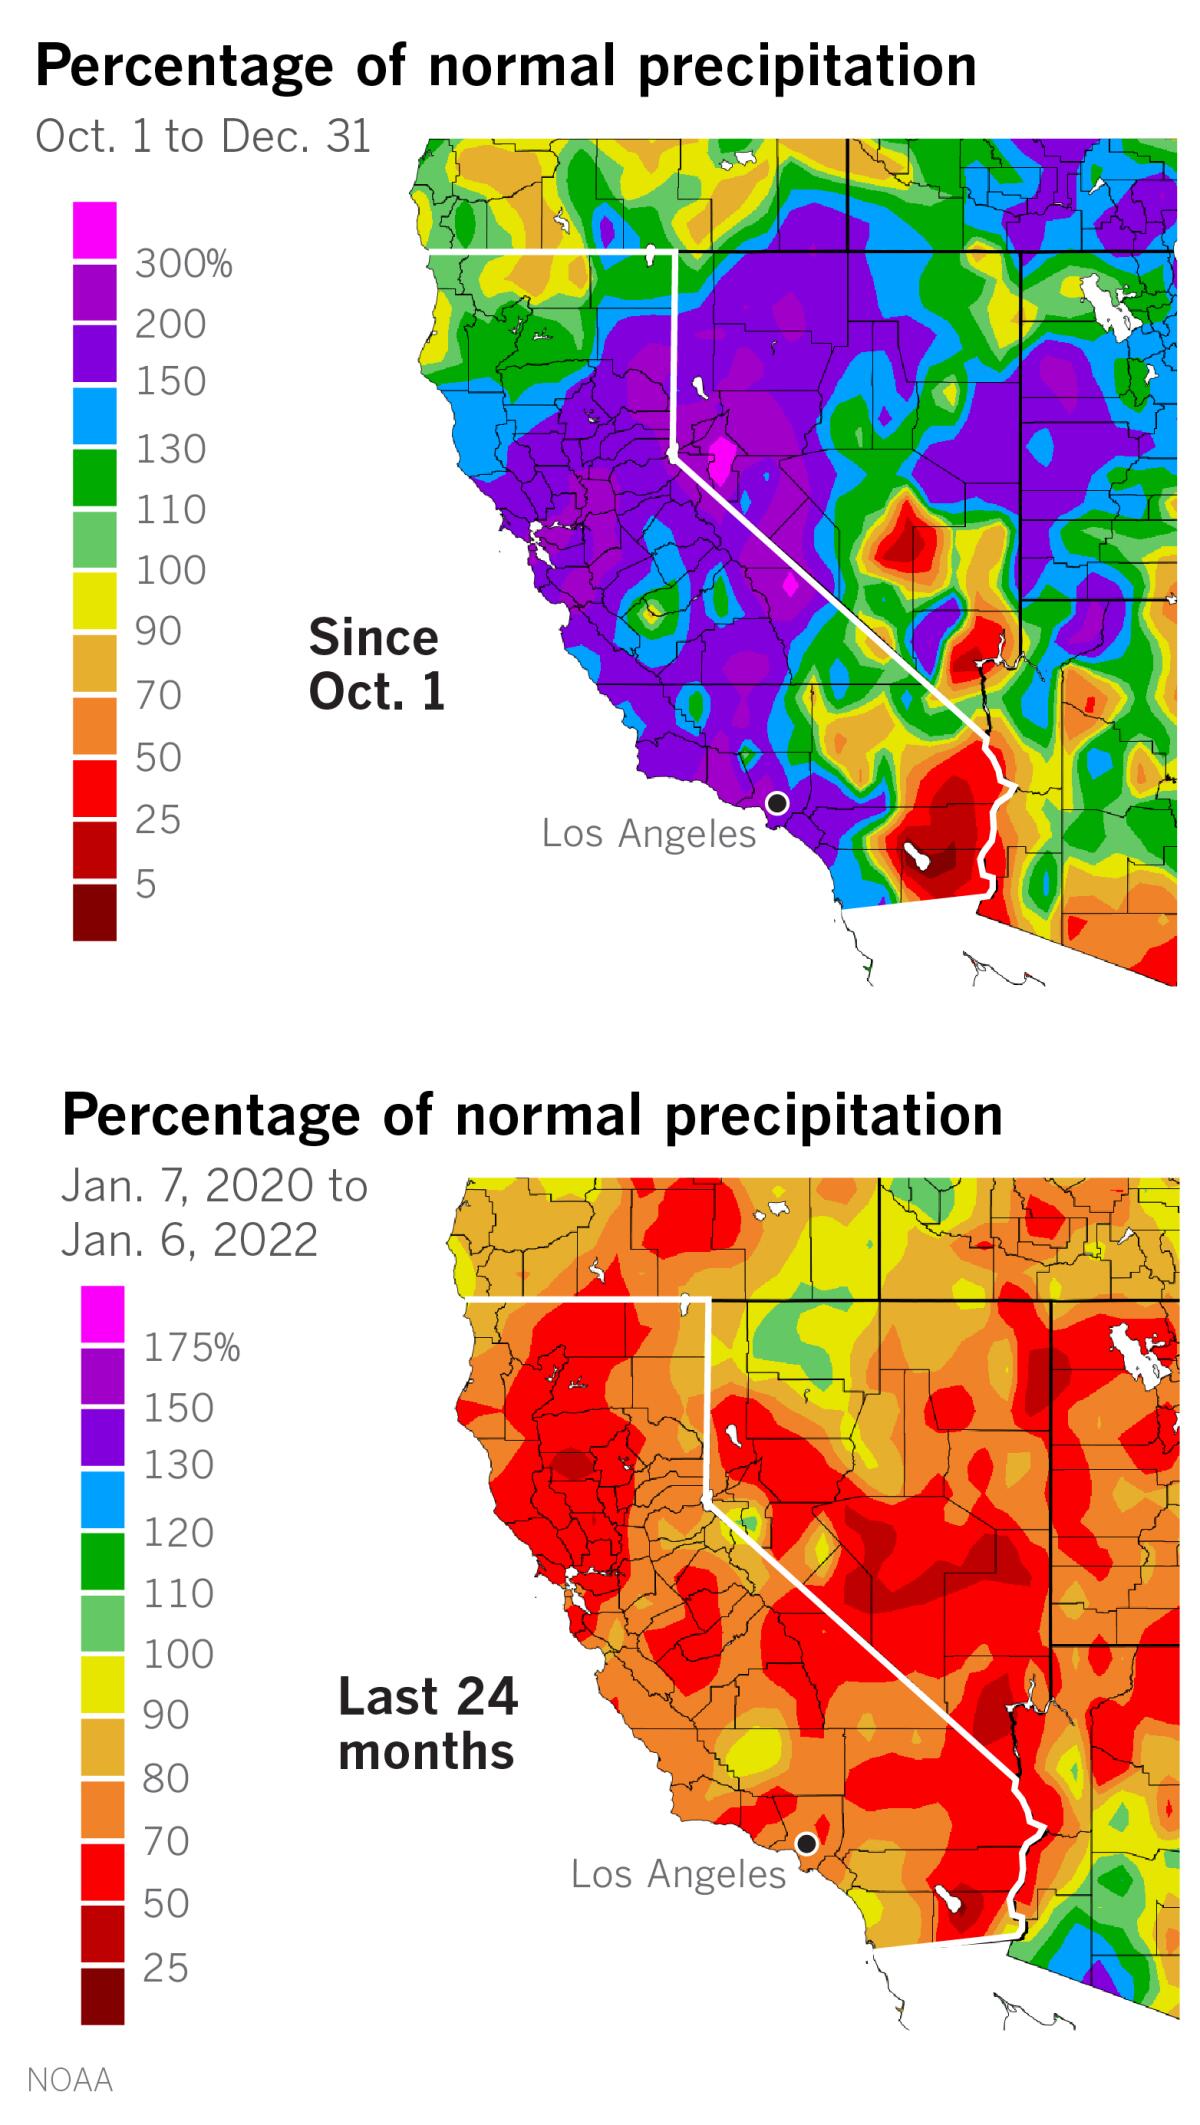
Though many Southern California locations are near or above 200% of normal precipitation through December, said Jayme Laber, a hydrologist at the National Weather Service in Oxnard, main-stem rivers saw minimal flow, and reservoir and groundwater levels are still low.
Most of Southern California’s bountiful precipitation last month was washed out to the Pacific, and most reservoirs in the region are low, Laber said. For example, Castaic Lake is about 45.6% full; Lake Piru is only 22.9% full; Lake Casitas is at 34.9%. Jameson Reservoir is the most flush, at 66.5%, but it is also one of the smallest reservoirs.
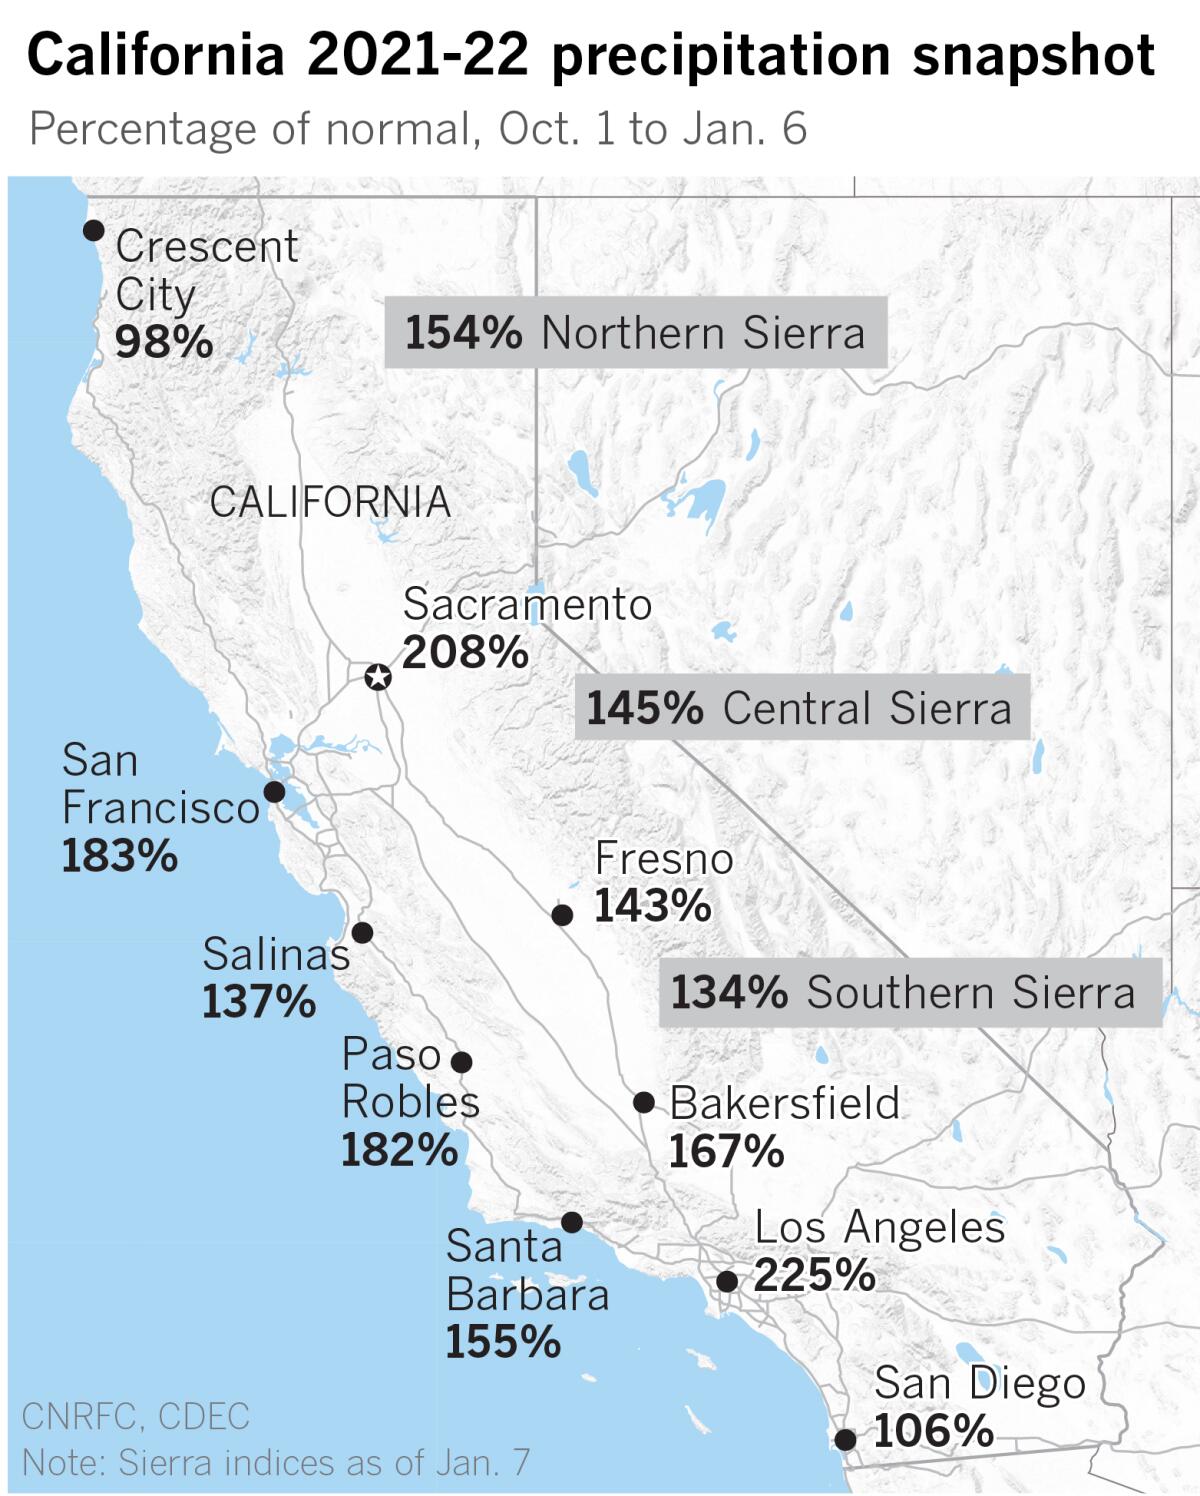
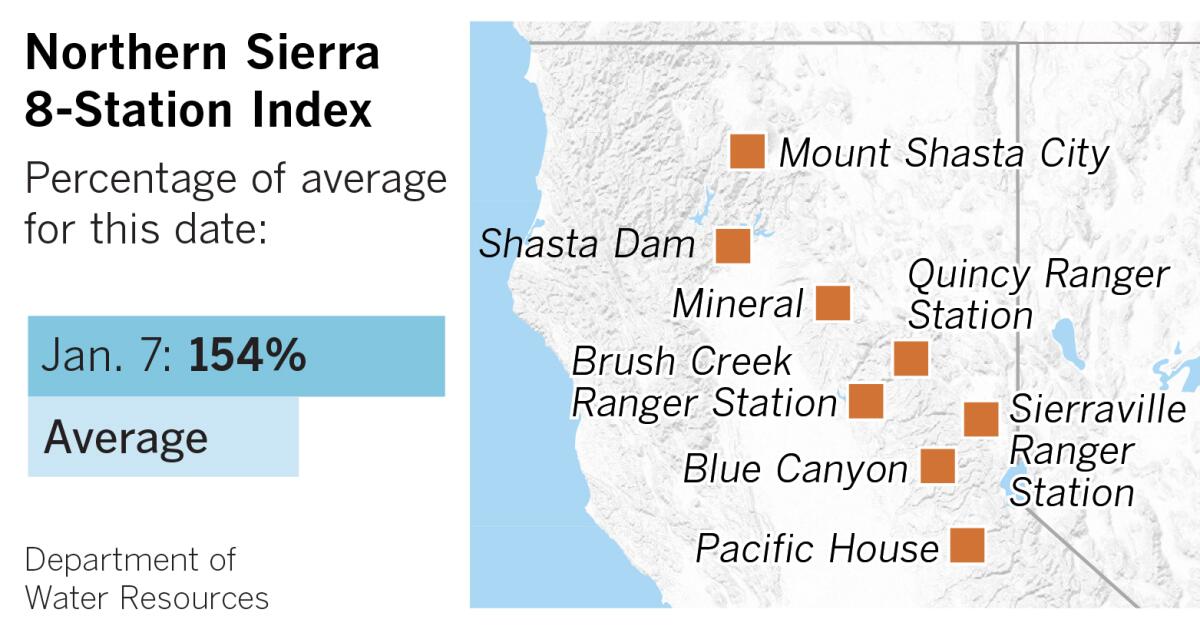
In Northern California, the key Northern Sierra 8-Station Index stood at 154% of average for Jan. 7, according to the California Department of Water Resources.
The index is the average of eight precipitation-measuring sites that provide a representative sample of the Northern Sierra’s major watersheds. These watersheds include the Sacramento, Feather, Yuba and American rivers, which flow into some of California’s biggest reservoirs, providing a large portion of the state’s water supply.
The Northern Sierra 8-Station Index showed 31.2 inches on Friday, which, at this point in the water year, places it in the neighborhood of two of the wettest water years on record: 2016-17 and 1982-83.
Among the major reservoirs fed by rivers in that northern region are Shasta Lake and Lake Oroville. As of Jan. 6, Shasta was only 31% full. Historically, it would be 52% full on average at this point. Lake Oroville is 40% full, compared with a 76% average at this point.
Fortunately for the state’s near-term water future, enormous amounts of moisture are held in cold storage in the High Sierra — a kind of snow bank. When it melts during the spring and summer, it will provide slow-release replenishment for California’s reservoirs. They, in turn, ship water to thirsty municipalities and farms up and down the state.
It will likely take at least a couple of wet years in a row for reservoirs to fully recover, Laber points out. That’s because although California has seen a lot of improvement over the last 90 days, deficits remain in the long term.
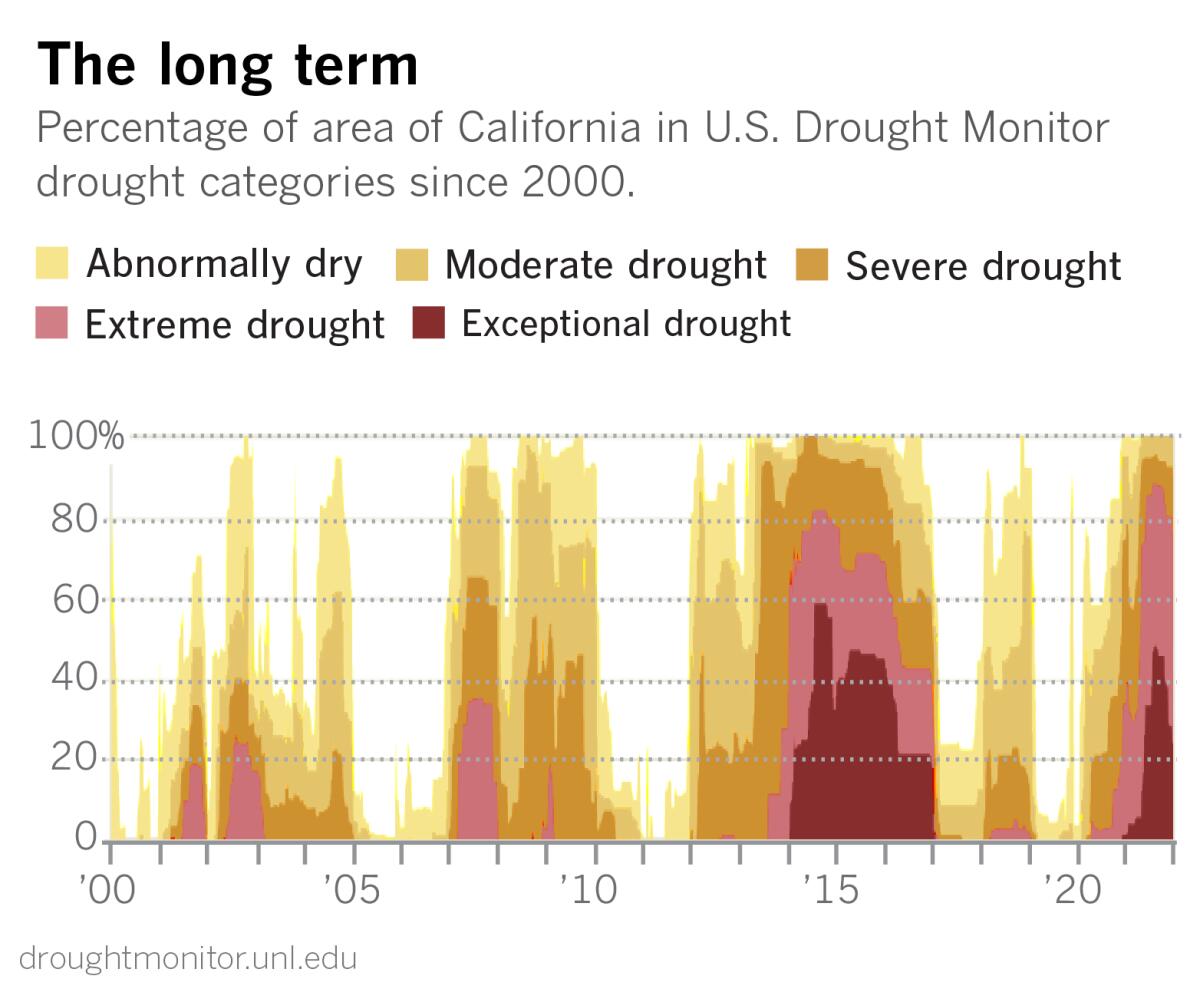
In fact, as the U.S. Drought Monitor’s chart of California since 2000 starkly shows, the state has been gripped by drought for most of the last 22 years. The prolonged dry spell from 2012 to 2017 includes a period of exceptional drought beginning in about 2014; the current dry period shows an even more abrupt emergence of exceptional drought.
Another way to contemplate the water situation in California is to look at the map of percentage of normal precipitation over the last 24 months, instead of just the last three. Though the map of the last three months celebrates the state’s plentiful recent precipitation, especially in December, the view of just how rain-deprived California has been for the last two years is sobering and guaranteed to put a damper on the party.
The Golden State has seen below-average precipitation in the last couple of years and is in the second year of La Niña. Typically, La Niña spells a drier-than-average winter, as seen last winter, and the longer-term outlooks this year still generally point in that direction.
Moreover, the current patch of dry years is part of a larger, decades-long trend toward drought with brief, deceptively wet interludes in California and across the West. And that’s all in the context of a warming world, where climate extremes are likely to be catastrophically amplified.
California’s water situation remains uncertain, and the state is a long way from being out of the drought. To safeguard drinking water supplies, the State Water Resources Control Board issued rules banning wasteful practices such as washing cars without a shutoff nozzle, excessive watering of lawns and hosing down driveways and sidewalks. Violators could face $500 fines.
A look at these graphics makes it clear why the board acted.
More to Read
Sign up for Essential California
The most important California stories and recommendations in your inbox every morning.
You may occasionally receive promotional content from the Los Angeles Times.
