(Scott Gelber / For The Times)
Why just look at your data when you could listen? Scientists are turning their data into sound to gain new insights into things as small as DNA and as large as galaxies.
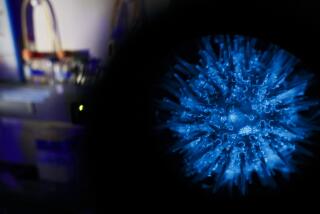
Biochemist Martin Gruebele regularly dons a pair of headphones in his lab at the University of Illinois. But instead of music, he listens to a cacophony of clinking, jarring noises — as if a group of robots were having a loud argument.
The payoff for this pain? These sounds help Gruebele understand how proteins in our body interact with water.
Protein molecules fold like shape-shifting transformers to carry out vital cellular functions in our body. When things go wrong, misfolded proteins can form plaques in the brain, a process that is thought to be the cause of neurodegenerative diseases such as Alzheimer’s.
Gruebele has devised computer simulations to understand protein folding, which occurs primarily in the water inside our cells. But the interactions between a protein and trillions of water molecules are too complex — and happen too fast — for him to see them in his simulations.
So he listens for them instead.
“You have to think of that sound in the same way that you think about a graph as opposed to a painting,” Gruebele said.
He uses a software program called Kyma to add a specific sound to each of the numerous bonds that occur as the protein folds. When played back, the sound brings order to the chaos by highlighting which particular interactions dominate.
“I can close my eyes and tell you, ‘Aha, there’s a protein-to-water hydrogen bond that just formed,’” he said as the track played out. “Once I’ve heard it, I can actually go back to the simulation and zoom in on that one specific water molecule and figure out which one it was and where it was making the bond.”
Gruebele is part of a growing community of researchers using sound to convey scientific phenomena. It’s the auditory equivalent of data visualization, and its adherents call it “data sonification.”
“You have to think of that sound in the same way that you think about a graph as opposed to a painting.”
— Martin Gruebele, biochemist
The concept isn’t entirely new. One of the earliest examples of using sound to represent data is the Geiger counter. This instrument was designed in 1928 to indicate the amount of radioactivity in a given place with clicking sounds. The faster the pace of the clicks, the more dangerous the environment. It’s a no-nonsense way to signal danger in a place that’s literally trying to kill you.
The Geiger counter was a mechanical device. But today, with digital audio, any piece of data can be mapped into sound.
Kyma was developed by Carla Scaletti, a composer and sound engineer based in Illinois. Its original purpose was all Hollywood — it was used in three Star Wars movies and the animated flick “Wall-E.” Its user interface allows individual sounds to be wired together like components in an electrical circuit. The result is a versatile tool that can produce endless audio combinations, even a soundtrack of human biology.
Scaletti believes sonification should be driven by the data alone.
“You have to be able to listen and analyze what you’re hearing and not just sit back and let it wash over you emotionally,” she said.
But for others such as ocean chemist and saxophonist Noah Germolus, the sounds of science ring closer to the sound of music.
Germolus, a PhD student studying ocean chemistry, collects water samples from the Atlantic and the Caribbean and brings them back to his lab at the Woods Hole Oceanographic Institution in Falmouth, Mass. There, he passes the samples through a series of chemical analysis tools that measure the abundance of nutrients essential for marine life, including carbon, nitrogen and phosphorus.
The data are recorded on his computer, then recast on a music staff.
“I take the intensity [of chemicals] and translate that to notes on a staff,” Germolus said. Data corresponding to low concentrations of chemicals are lower notes, and high concentrations are higher notes.
The resulting score echoes the diversity of undersea environments. There are deserts and oases based on the richness of nutrients and the marine life they attract.
All of it is reflected in Germolus’ music. His favorite soundtrack is of the barren deep ocean.
“I think it sounds a little bit melancholy,” he said. “The expression that it’s supposed to convey is … you’re a microbe floating around, the water itself isn’t moving very much, you’re not moving very much, your metabolism is slow.”
Germolus had recorded the amount of dissolved organic carbon, the signature ingredient of life. He knew it would be scarce more than a mile beneath the surface, so the desolate tone wasn’t a surprise.
But surprises are welcome. Germolus recalled listening to data from the ocean surface and hearing a high G among a bunch of low notes, making him wonder, “What’s that? What’s going on here?”
The sudden transition might be a marker of aromatic compounds, he said. “That kind of stuff is interesting and important, especially as it relates to both pollutants and as it relates to organic compounds.”
While Germolus makes a sort of jazz out of ocean nutrients, Jon Bellona uses data sonification to help us listen to the oceans breathe.
Working with ocean data collected in 2017, Bellona uses software to track the movement of carbon dioxide in and out of the water. When cold winter waters suck in carbon dioxide from the atmosphere, he hears low rumbling sounds. When the warmer oceans exhale the gas in the summer, he hears a scrunchy sound resembling waves crashing into the shore.
“Sonification can help researchers do day-to-day work,” said Bellona, a sound artist at the University of Oregon. It’s good for “discovering new patterns that we cannot see, and at the same time, in being inclusive.”
Amy Bower, an oceanographer at the Woods Hole Oceanographic Institution, said she was blown away by Bellona’s ocean track.
Bower is legally blind. While in graduate school, she was diagnosed with retinitis pigmentosa, a condition that causes vision to deteriorate slowly over time.
“For years, I’ve been investigating what’s available to me when it comes to accessing graphics and data,” Bower said. But without much success — the fact that science relies so heavily on plots and charts is a huge hurdle for visually impaired researchers like her.
Data sonification changes that. By listening to Bellona’s audio, “I could actually piece it together the way I used to when I would look at a graph,” she said.
Kimberly Arcand, a data visualization expert with NASA’s Chandra X-ray Observatory, views sonification as just another way of translating data from one form into another. It’s something astronomers already do all the time to enhance their understanding of light that’s outside the narrow band of wavelengths our eyes can detect.
(Scott Gelber / For The Times)
“What the human eye can see is just a tiny, tiny sliver of what is out there in the universe,” Arcand said. “It’s like the middle C, and a couple of keys on either side of it on a piano keyboard.”
Many pictures of space, including the infrared images recently released by the James Webb Space Telescope, have been translated into visible light that humans can perceive, she pointed out, “so why not do the same with sound?”
For one thing, it makes astronomy accessible to those unable to see.
Consider an image of the center of the Milky Way galaxy created with data from the Hubble (which captures visible light), Spitzer (which sees the longer wavelengths of infrared light) and Chandra (which captures shorter-wavelength X-rays) space telescopes. Arcand assigns distinct sounds to different wavelengths of light, which users can hear as a cursor scans from left to right.
The sprinkling of stars is conveyed by the tinkling of wind chimes, while the widespread interstellar gas and dust draw out sustained stringed notes. Places with high-energy X-ray emissions strike deep piano notes. The whole symphony combines in a crescendo at the very center of the galaxy, where a supermassive black hole is shrouded by extremely dense cosmic matter.
Visually impaired people have described Arcand’s aural translation using words such as “spooky,” “scary,” “lovely,” “gorgeous” and “awe-inspiring,” she said. But what gratified her most was making sighted audiences aware that “there are people who can’t see the universe like they’re seeing right now.”
Bower said there are two schools of thought about taking liberties with sounds.
“If the purpose is just to get the public excited about science, then I’m all for making it as much an art,” the oceanographer said. “But if it’s for science, you gotta be faithful to the data.”
“What the human eye can see is just a tiny, tiny sliver of what is out there in the universe.”
— Kimberly Arcand, NASA data visualization expert
Mark Temple, a molecular biologist at Western Sydney University, sonifies data with both goals in mind.
“I’ve got a scientific motivation, and I’ve got sort of a musical motivation. I keep them independent,” said Temple, who used to be a drummer for the Australian indie pop band the Hummingbirds.
Today he can be described as the “DNA DJ.” He assigns a distinct note to each of the four bases of the DNA molecule — A, C, G and T.
By listening to a long string of genetic code, “you can easily distinguish repetitive DNA sequences from more complex DNA sequences,” Temple said.
For instance, people with Huntington’s disease have a three-letter segment of a particular gene that repeats significantly more often than it does in people who don’t have the disease. In Temple’s sonification of this gene, the telltale sign of Huntington’s sounds like a broken record.
Temple’s DNA discography has evolved in musical style. His newer tracks bring in more variation, such as unique sounds marking the start and the end of a gene, additional notes for active parts of DNA and background harmonies for the inactive sequences in between. A recent composition based on the gene for the coronavirus spike protein, which has 4,000 chemical letters, takes about four minutes to get through.
Temple has also created a web app that lets anyone plug and play their own DNA that’s been sequenced by a company such as 23andMe or Ancestry.com.
“If you have a genetic disease, and you’ve got something that you want to try and understand, I think playing the difference between a healthy individual and a diseased individual — so that the differences stand out — would be interesting to people.”
When it comes to sonification, every creator has different goals, uses and audiences. They also have their own ways of making sounds, from Scaletti’s sound design software and Temple’s DNA-coding algorithms to Germolus’ sheets of music.
But they all agree that no single tool can achieve it all.
“If you want to create things, you need to have the tools to do it. And they need to be easy and intuitive to use,” Gruebele said. (This is also true for visual graphics, a field for which plenty of software exists that everyone can use.)
Bower and Bellona are working to develop universal sonification methods, which will be the focus of a forthcoming project called Accessible Oceans.
They hope more researchers understand the value of using sound to present and analyze data. For a discipline that strives to make sense of the world we live in, Bellona said, sonification represented “a really exciting” shift in how scientists can utilize other senses toward communicating information.
Scaletti agreed that sound has the power to convey a lot of meaning.
“People know that because of language,” she said, “but they think everything else is music.” That’s why she’s carving a new niche in the human soundscape for science.


