Op-Ed: The Labor Day wage picture in California. (Conclusion: learn how to deal blackjack)
So you wanted to be a fireman when you were a kid?
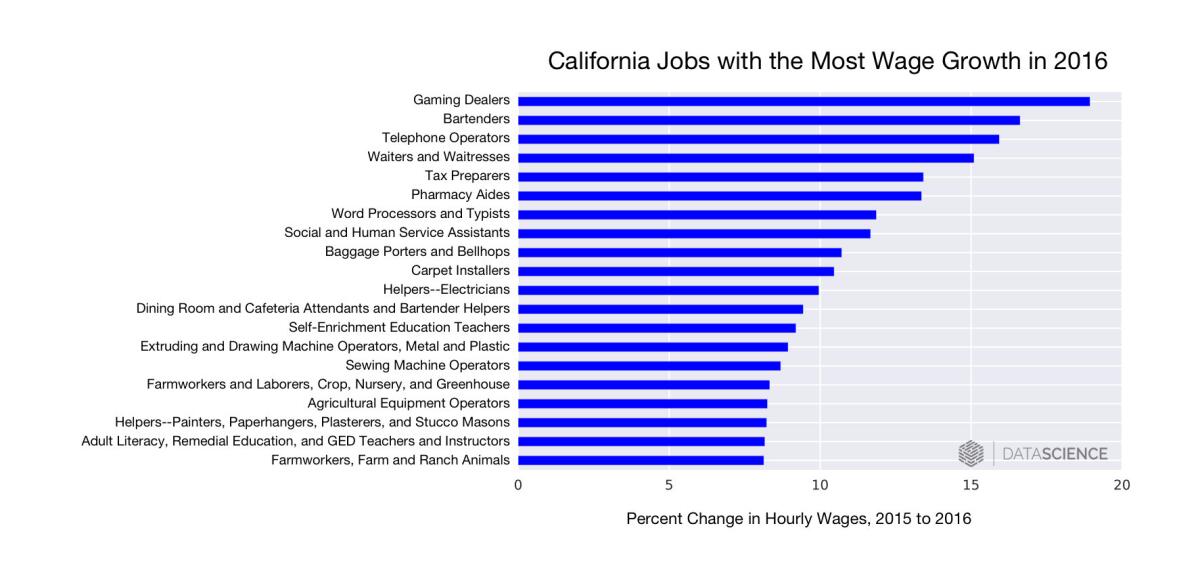
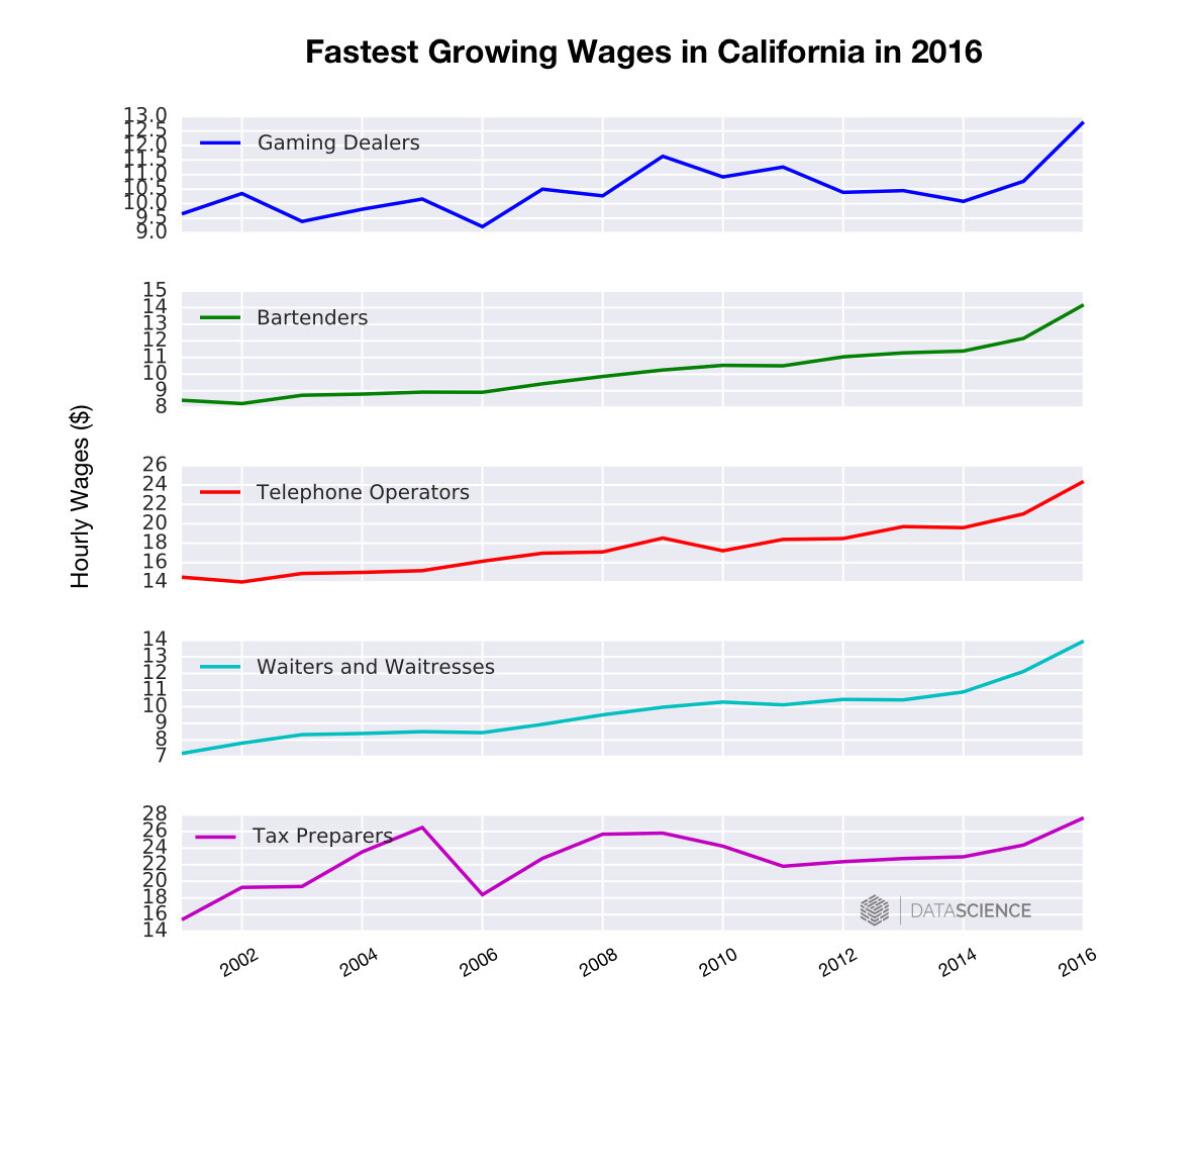
Firefighting continues to be as noble a profession as they come, but from an economic perspective, helping your fellow man isn’t as rewarding as it once was. An analysis of hourly wage estimates in California over the past 15 years, complied from California Employment Development Department data, reveals that these are heady days for carpet installers, bartenders and gaming dealers.
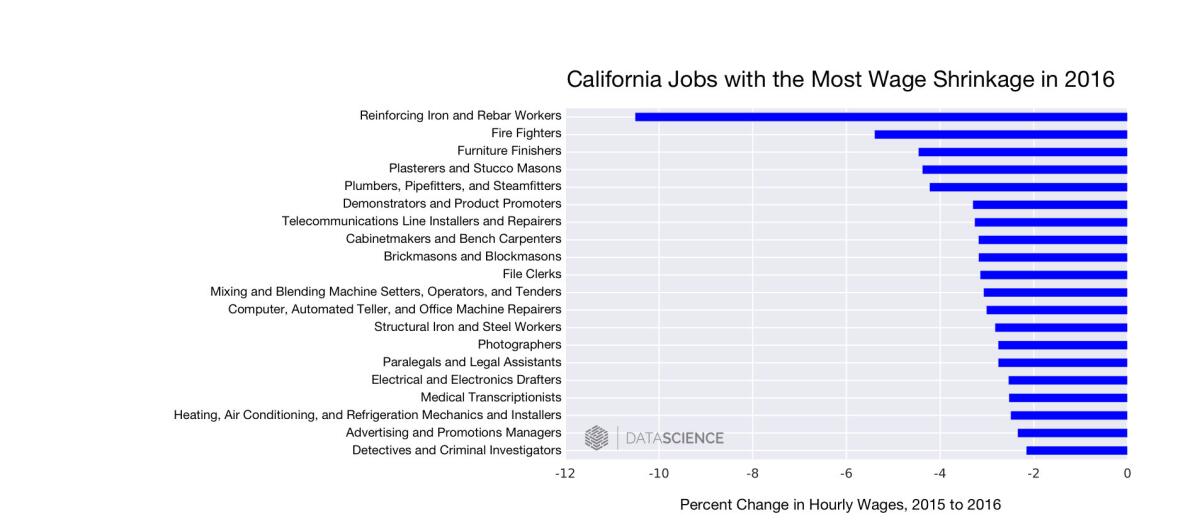
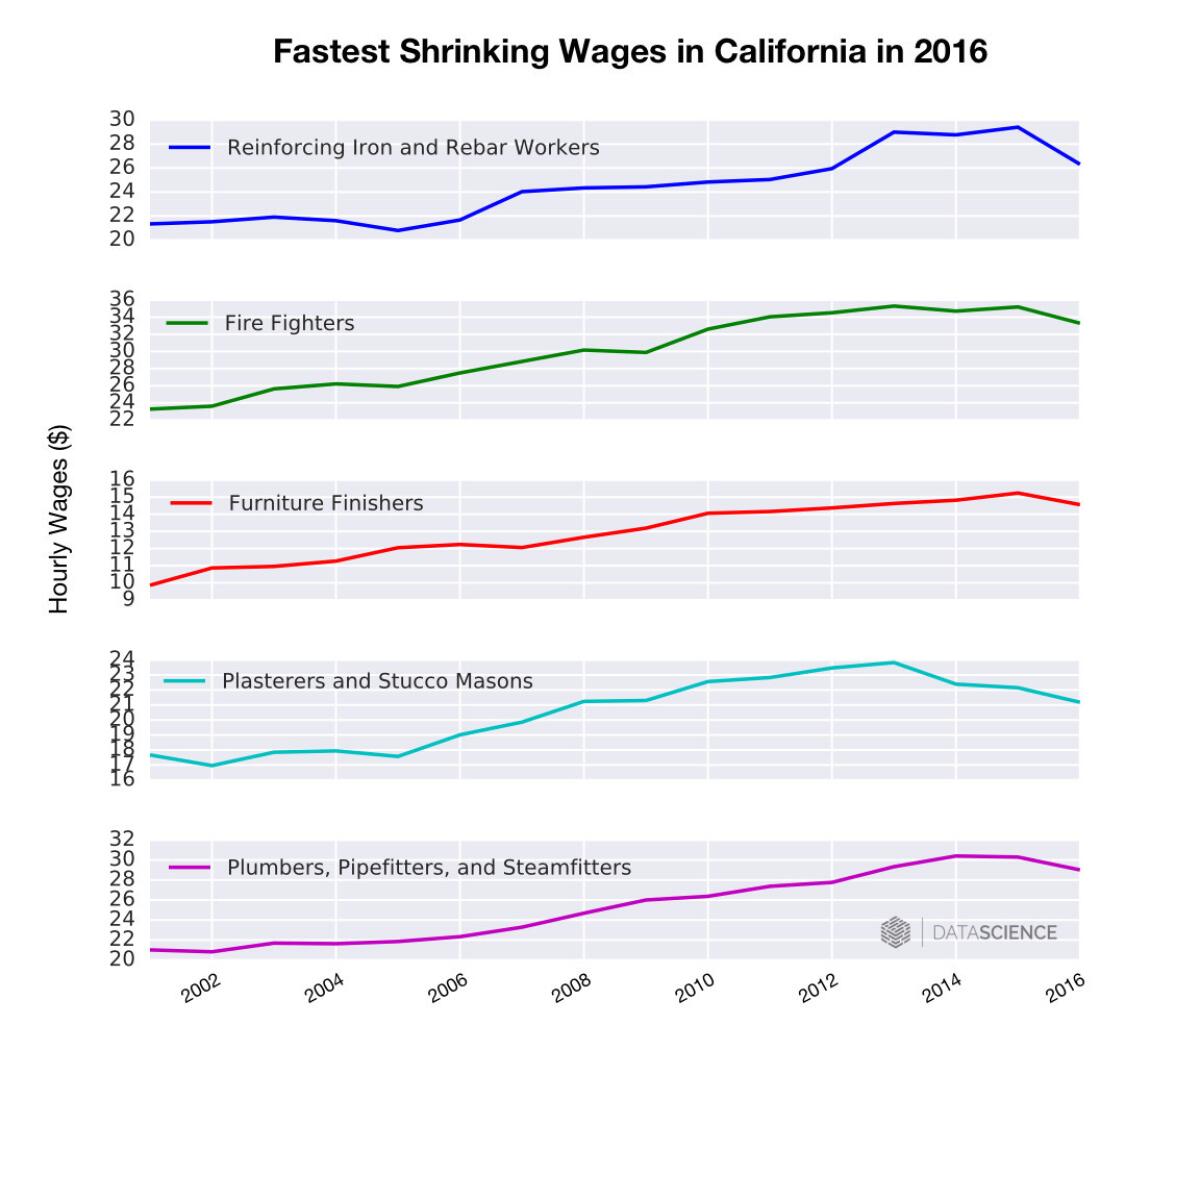
Firefighters, plumbers, and furniture finishers, meanwhile have seen their hourly wages begin to dip.
There have been other winners and losers on the wage front. The bar graphs below show the 20 highest and 20 lowest percent changes in average wages per occupation from 2015 to 2016. The line graphs shows the percent change in hourly wage for the top and bottom five professions in 2016, and trace the hourly wage of these occupations since 2001.


*A note on the data: Occupations referring to “sales agent”, such as insurance or real estate agents, were excluded from the analysis as their commission-based compensation is poorly reflected by fluctuations in hourly wage. Full details on the methodology and tools used to perform the analysis are located here.
Dave Goodsmith is a data scientist at DataScience, Inc.. You can find him on the DataScience blog and @thegoodsmith.
Follow the Opinion section on Twitter @latimesopinion or Facebook
A cure for the common opinion
Get thought-provoking perspectives with our weekly newsletter.
You may occasionally receive promotional content from the Los Angeles Times.


