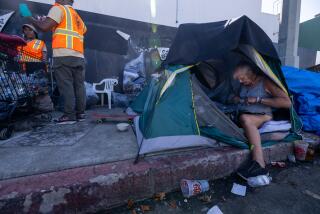
Is L.A.’s homeless population closer to 100,000? Nonprofit offers an alternative view of the data

The Los Angeles homeless count has become an annual civic drama, starting with thousands of volunteers spreading across the county on three nights in January and ending five months later with the unveiling of the new number: 52,765 this year.
The practice has been criticized for its implied precision — as if it were possible to count a diffuse and reclusive population down to the last individual. But the effort has also faced criticism for leaving out important information, such as how many people become homeless during the year and how long they remain on the street.
To fill in those gaps, the Economic Roundtable examined data collected by the Los Angeles Homeless Services Authority in 2017.
After months of analysis, the group came up with a new statistical approach that yields a very different number: 102,278 — reflecting the number of people who become homeless at one time or another during the year.
It means that for just about every person living on the street or in a shelter on a given night, another person was homeless at least once during the prior year, some of them more than once, the group found.
Daniel Flaming, president of the Economic Roundtable, said the findings can provide a better understanding of why some people escape homelessness quickly after a job loss or an eviction while others become persistently homeless.
That, in turn, could lead to better use of scarce resources, Flaming said. The analysis, published earlier this month, also looked at how long people stay homeless.
“What we see is that a lot of people make it out fairly quickly and don’t need a lot of help,” he said. “Maybe a third are homeless for a year or more.”
The organization’s goal is to develop analytical tools to “find these high-need individuals before there is so much wreckage in their lives,” Flaming said.
The Economic Roundtable, a Los Angeles-based nonprofit that seeks to guide public policy with research on economic, social and environmental conditions, has been critical of the homeless authority’s methodology, especially its reluctance to acknowledge statistical error. (The Economic Roundtable says the authority’s estimate of the annual homeless number could be high or low by up to 5%.)
The group’s project culminated in August when about two dozen volunteer analysts, with the help of the data sciences nonprofit DataKind, assembled for a weekend of computer coding.
Data scientist Paul Beeman led one group that built interactive charts to illustrate the numbers in the homeless authority’s annual demographic survey.
His goal of showing changes in the homeless population over several years ran into trouble when he found that the questions in the survey often changed.
One question, for example, asked those who slept in tents how many others lived with them. Many didn’t answer in some years because there was no way to report none.
Beeman eventually concluded that without consistent data it was impossible to make a “visualization that is representative to any sort of truth.”
Consequently, the web page his group produced covers only two years. It breaks down the homeless population in 2016 and 2017 by age, race and gender and other statistics, such as the reason for becoming homeless.
The homeless authority, which reviewed the group’s findings, said in a statement that it will soon post a USC paper that “may address some of the concerns addressed in the latest Economic Roundtable report.”
The agency said it is working with USC on “potential improvements” next year. In a statement, it said it would consider the Economic Roundtable’s report but cautioned that it makes changes to its methodology to improve the “accuracy and stability of the estimates,” which it prioritizes “over year-by-year comparability.”
A group led by Jane Carlen, the Economic Roundtable’s research statistician, examined what is called the annualized total — how many people become homeless at any time during a year. The homeless authority makes its own estimate of the number but has never included it in its annual presentation.
Besides being hard to express, the statistic had proved unreliable, climbing almost 70,000 one year, then sliding 80,000 over the next five years while homelessness was increasing.
Carlen attributed the swing to inconsistent data collection and recommended changes to improve it.
More important, Flaming said, Carlen and her team came up with new statistical methods to assess how long people remain homeless.
According to their calculation, nearly half of those who become homeless obtain new housing within six months, but fewer regain housing after six months. After a year, 35% remain homeless.
It could be possible, Flaming said, to prevent that slide into persistent homelessness with intensive help at the beginning.
“Our idea is to intervene early much more intensely than you normally would, maybe a $20,000 package to give them a new foothold in a new job,” he said.
Twitter: @LATDoug
More to Read
Sign up for Essential California
The most important California stories and recommendations in your inbox every morning.
You may occasionally receive promotional content from the Los Angeles Times.


